Same here, unfortunately. I'm also on 1.6.1170 AE. Other SKSE plugins, such as DescriptionFramework, MCMHelper, and MoreInformativeConsole, are spitting out their logs without a problem. I really, really want to make use of this tool. Author, can I provide any other information to help you debug?
The framework that I built my mod on top off (CommonLibSSE-NG) never ended up getting properly updated for these later versions of the game, which is why finding the correct directory to write to got broken.
I tried fixing it once, but apparently that didn't fix it. I have no interest in installing versions of the game other than 1.5.97 on my machine any time soon, which means I also can't test anything I try to fix this, and I can't spare the time to just randomly try things and wait for users to tell me whether or not it helped without being able to test it myself.
If anyone knowledgeable of SKSE plugin development can tell me (my source code is available online) what lines of code to change to fix it, I'm happy to do that, but otherwise there's not much I can do any time soon.
Dang. I updated to 1.6.1170 and seems to see a lag/slowdown, was able to use Papyrus Profiler on 1.5.9.7 before, didn't know the later versions weren't working.
I similarly would love an updated version of this mod. However I will note that the instructions for reading the flame graph works with the logs generated with these instructions https://www.nexusmods.com/skyrimspecialedition/mods/68243/?tab=description
Dayum, i was looking for tool, which could pinpoint issue in Riverwood, where game goes to not responding state, been investigating this for a month xD
self-insert moment lol you can try my MO2 plugin that will make files that mistakenly go to Skyrim.INI go to "Skyrim Special Edition" as it should. only needed for 1.6.117x (earlier version of skyrim don't have this problem) https://www.nexusmods.com/skyrimspecialedition/mods/144932
I have a question. I just started using Papyrus Profiler today to check the level of script load, and the log shows MD- DeathEffectsHumanoidMagicScript OnMagicEffectApply 7968, Most of the numbers in the log are in the tens and hundreds digits except for this script. The numbers in this script are astonishingly large, and the comment section of this original mod has long been closed. Does this mean that this script is very heavy and I should stop using it?
What mod does that script come from? It could be interesting for me to look at.
It probably does mean that it is relatively heavy compared to other scripts that were running in your game at the same time. But I always want to be extremely careful with such conclusions. Maybe you were just measuring over a relatively short amount of time and specifically doing something where that script happens to be really important, and it's not a good reflection of overall gameplay? I also never want to directly say something like "yeah you should stop using it". Just because a script is putting in lots of work, doesn't mean that it's bad. Maybe it needs to put in a lot of work to accomplish what it's intended to accomplish. If your game runs fine with no issues, who cares? It's only a problem if it causes issues like script lag.
Thank you for your reply. I am investigating whether there are any heavy scripts causing CPU bottlenecks in my game. I will pay more attention to this mod for a period of time This mod is Maximum Destruction, written by the same author as Maximum Carnage, and both have closed the comment section. I also used Maximum Destruction - Corpus Explosion Remover, which I only tested for one or two minutes, but I am still confused. The purpose of this mod is to create different visual effects after magic kills enemies, such as flames burning enemy corpses to ashes. However, I have been using the initial save during testing, without encountering any hostile NPC or using magic, just wandering aimlessly outside the city. Even so, I still see three to four instances of MD Path Effects Humanoid Magic in my logs. Script OnMagicEffectively Apply 7968.
oof, oh, it uses OnMagicEffectApply. You mentioned that in your first comment also already, but I missed it there. Yeah, that kind of script is going to be doing a lot of processing, especially in heavily modded games (especially if any of your other mods use the "cloak method" to distribute scripts among NPCs).
I might look into the scripts in more detail myself later on. It might be possible to effectively optimise using different events for PO3's Papyrus Extender. If that's possible, I'd also have to contact the author of the mod to get permission to publish anything like that though. And I'd need to have time to work on this in the first place. So, that's going to take some time.
Thank you for your answer. In the future, I will test this type of script first and then consider whether to keep it in my game for a long time. My game often experiences low CPU and GPU usage, and I can feel the lag of SMP and scripts in this situation. After turning off JK major maintenance or similar Notwl tree mods that theoretically affect performance, I found that there was no frame rate change. I suspected that there was a mod that affected the entire game due to some errors. After turning off this mod, my game started to run smoothly. Perhaps it was not because of other magical reasons, but because I have a huge list of mods that may just conflict with my other mods. But as an outsider in this field, I still think it's safer to avoid using it. I can't ignore its amazing performance in the logs.
Hey, I have skyrim special edition through steam and I just installed the papyrus profiler through the nexus mod manager. After installing the manager says I am missing a file or something called "nl_cmd.esl" and I'm not sure what to do. I am new to modding and don't have a lot of experience diving through my files so any help would be appreciated.
1) understanding this log: https://pastebin.com/mzRF7zb5 - I took a look in speedscope and saw a lot of iHud and Campfire calls, but was hoping for more insights into it.
2) Is there a tool that helps measure script intensity (as opposed to # of calls which this great tool is measuring)?
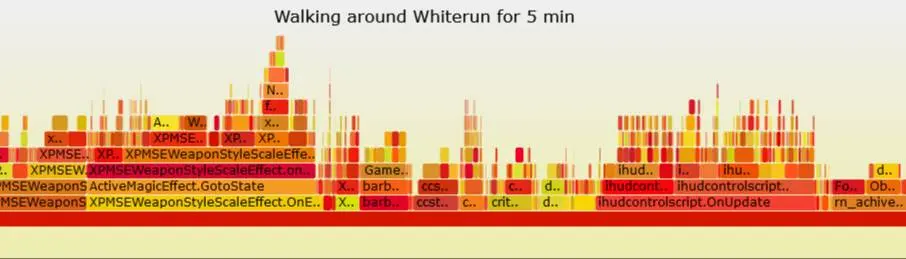
Hey so I'm using your app and https://www.speedscope.app/ to generate the flamegraph (left heavy), I'm wondering how I should be reading this data, for example what is considered bad, etc.
To answer this question simply, it tracks the scripts running on each frame. The heavier the script load is, the more data you'll see. It's not necessarily a "bad" thing, it just means that papyrus is busy. If too much happens at once, or many scripts fire and you get a crash, you can utilize this to try and trace which mods caused the issue. This could be as simple as configuring an MCM to reduce the number of script calls for performance gain (if the mod author included it - this is uncommon at best) or as complicated as either reaching out to the mod author with the data you collected, or creating manual patches/modifying the scripts yourself.
Most users don't need this. But if you are a user building your own modlist and you're looking for incompatibilities not found in xedit, this is an invaluable tool.
It is a tool for easily locating scripts with unexpected behavior during development or troubleshooting. The number of functions being executed can be a pointer, but not always. The bar size correlates to the number of functions being called, not their performance impact: a wrist watch has more cogs than a truck doesn't mean it consumes more energy.
The graph also isn't representing bars as some kind of a portion of a total processing capacity. If you have nothing going around to begin with, light routine systems will start showing up as larger chunks.
Since people are having trouble with the two options to activate these in-game, could you maybe make an optional addon for this? I'm hoping the authors will fix things, but NL_CMD has the same script not found bug for years now.
This is such a useful tool. Thank you! Worked a treat on my mess of a game v 1170. I used the recommended Speedscope app, site, which was most useful in working out which scripts were hogging frames. Cheers!
Thanks for this mod, i hope maybe you could help me understand why my game has started randomly freezing after like 100 hours of gameplay without almost any freeze. I read that probably it is related to papyrus overload but i don't understand if there is a single mod responsible for this or if it is something more complex.
So i downloaded your tool and set StartupConfig=ProfileForeverWriteRealtime.json in ini file. This is one of the log generated: https://imgur.com/a/LMscSgR Is there someway to detect what exactly makes my game freeze each time? If there are other information needed just let me know
No, Papyrus Profiler can never definitively tell you what causes a freeze. It can only tell you which functions are being called frequently (relative to others). But if those calls happen to be at times that otherwise the game is relatively quiet, for example, that's not a problem.
At best it can give guidance for where to look first for opportunities to maybe optimise scripts. From just a picture, it's difficult to say much more though. The raw SVG or log file could be interesting.
Yeah so that's not going to say anything about freezing though.
Mostly I see the scripts I already know from prior testing that do a lot of work, but it's okay, they have to.
Eo Geom turns out to have some rather questionable scripting though.
I'd be interested in knowing where the "Placable_CreationMenu_Shortcut" script comes from, and taking a look at it. I have no idea what that script is / where it would come from. If you are using Mod Organizer 2, it could tell you where that particular file (in the Data/scripts directory) is coming from.
In reality i hoped this log could contain important information because it is generated after about 2 minutes of game before an almost 100% reproducible freeze happening in the outdoors. I am testing and reloading always this autosave hoping that someway i will find out what is the problem.
Though i have to say that, when i load the autosave in ReSaver from fallrimtools, it shows 2900 stacks and 200 frames also suggesting that papyrus is overloaded. This is mostly true cause when i load the save the message "VM overstressed" appears several times, but this has always happened quite frequently in my game in the first 100 hours of gameplay and never, never during this time i had experienced more than some really rare random freeze.
So what the hell has changed now with respect to the beginning of the game? What i still cannot explain is why my game has started random freezing too frequently and, for what i can tell so far, always in the outdoors.
I hope you could help me at least in identifying a more precise direction to look at...
About the "Placable_CreationMenu_Shortcut script " i already gave a look at it and found out the file placable_creationmenu_shorcut.pex belongs to "Skyrim - Settlement Builder" mod. So i completely removed the mod and load the same autosave but nonetheless the game freezed anyway (and the new log generated by papyrus profiler didn't contain anymore this script obviously)
If any scripted mod is to blame, right now, my best guess would be Eo Geom. That one at least looks like it would have a risk of quickly piling up. It has a few scripts that are running constantly, forever, at an extremely high frequency. Still can't guarantee that's it though. It might also simply not be any single individual mod that is to blame, but some combination.
So your guess surely has proved to be reasonable: i found out that those Eo Geom scripts belong to "Ultimate Deadly Encounters and Spawns" which is a highly scripted mod as said in its mod page.
I deactivated the mod and did several tests always starting from the same autosave and trying to do the same actions each time. Apparently, with the mod deactivated, freezes frequency halved but i need to do a lot more tests, comparing with the cases in which this mod is activated
Anyway i am also monitoring cpu and gpu performances during gameplay and especially during freezes. Only thing noticeable is that gpu immediately drops from 100% utilization to 0% when the game freezes. I don't know if this is usual but reading on the internet it seems that gpu issues are likely to be related to freezes. Besides, when some weeks ago i started experiencing too many freezes, i underclocked my gpu using msi afterburners and the game returned playable...but some time after freezes came back, even if frequency is not the same apparently.
So my papyrus is surely overloaded but i don't know for now if it is the main culprit
Anyway how did you understood that those eo geom scripts are running constanty and are called too much? From what i can see looking the log i posted and uploaded on speedscope there are many others scripts that are called much more than these eo geom, but probably i'm not interpreting right
Couldn't see that just from the plot. But I've inspected many of these kinds of graphs before (from my own play, and others'), and already recognised many of the other scripts that are also frequently running. So, for all of these other ones, I already knew they were fine (in that, they can't be significantly optimised to do exactly what they're already doing, but more efficiently, and their calls are reasonably spread out over time).
Eo geom I didn't recognise, so I downloaded the mod to look at the scripts, and in there I saw some questionable things. They probably actually *try* to run even much more frequently than they do in your game, but fail to because your engine is probably already clogged.
Fine, i'll do more testing to see if there are significant differences with this mod deactivated.
According to you is it possible though that gpu performance is negatively impacting the game and raising frezees likelihood? Otherwise i couldn't explain why underclocking gpu has made my game almost decently playable It would be also great to know how to spot the most impacting scripts in my load order...from what i understood papyrus profiler is only able to show the frequency of scripts but not their impact in terms of engine resources
I don't know enough about the rest of the engine really to say anything definitive about whether that may or may not be possible.
As for scripts, I also don't know of better tools to give more definitive info. I use my profiler to guide my attention/focus towards certain scripts, but I then still open up their source code and inspect them manually and just read what they do.
Thanks anyway for all the help. At least i have now some important information to understand where to look for.
You were also right about Eo Geom scripts trying to run even more frequently but failing because engine is overloaded: i did some tests with the mod "Papyrus Tweaks NG" activated and modyfing some of its settings i noticed that reloading the same autosave now there is almost always a new ambush of enemies spawned by that mod. This wasn't happening before in almost all the other tests i did. Still game freezes after a bit but i really hope to be on the right track..


121 comments
no logs or any file related to papyrusprofiler
using latest version 1.6.1170 AE
Author, can I provide any other information to help you debug?
(edit) nvm found it.
I tried fixing it once, but apparently that didn't fix it. I have no interest in installing versions of the game other than 1.5.97 on my machine any time soon, which means I also can't test anything I try to fix this, and I can't spare the time to just randomly try things and wait for users to tell me whether or not it helped without being able to test it myself.
If anyone knowledgeable of SKSE plugin development can tell me (my source code is available online) what lines of code to change to fix it, I'm happy to do that, but otherwise there's not much I can do any time soon.
I came across this reddit post so was wondering if it might help you Borgut1337.
https://www.nexusmods.com/skyrimspecialedition/mods/68243/?tab=description
Documents/My Games/Skyrim.INI/SKSEinstead of the expected place. Check there!using the latest version of Skyrim: 1.6.1170
you can try my MO2 plugin that will make files that mistakenly go to Skyrim.INI go to "Skyrim Special Edition" as it should.
only needed for 1.6.117x (earlier version of skyrim don't have this problem)
https://www.nexusmods.com/skyrimspecialedition/mods/144932
DeathEffectsHumanoidMagicScript OnMagicEffectApply 7968, Most of the numbers in the log are in the tens and hundreds digits except for this script. The numbers in this script are astonishingly large, and the comment section of this original mod has long been closed. Does this mean that this script is very heavy and I should stop using it?
It probably does mean that it is relatively heavy compared to other scripts that were running in your game at the same time. But I always want to be extremely careful with such conclusions. Maybe you were just measuring over a relatively short amount of time and specifically doing something where that script happens to be really important, and it's not a good reflection of overall gameplay? I also never want to directly say something like "yeah you should stop using it". Just because a script is putting in lots of work, doesn't mean that it's bad. Maybe it needs to put in a lot of work to accomplish what it's intended to accomplish. If your game runs fine with no issues, who cares? It's only a problem if it causes issues like script lag.
I might look into the scripts in more detail myself later on. It might be possible to effectively optimise using different events for PO3's Papyrus Extender. If that's possible, I'd also have to contact the author of the mod to get permission to publish anything like that though. And I'd need to have time to work on this in the first place. So, that's going to take some time.
1) understanding this log: https://pastebin.com/mzRF7zb5 - I took a look in speedscope and saw a lot of iHud and Campfire calls, but was hoping for more insights into it.
2) Is there a tool that helps measure script intensity (as opposed to # of calls which this great tool is measuring)?
Most users don't need this. But if you are a user building your own modlist and you're looking for incompatibilities not found in xedit, this is an invaluable tool.
The number of functions being executed can be a pointer, but not always.
The bar size correlates to the number of functions being called, not their performance impact: a wrist watch has more cogs than a truck doesn't mean it consumes more energy.
The graph also isn't representing bars as some kind of a portion of a total processing capacity. If you have nothing going around to begin with, light routine systems will start showing up as larger chunks.
I'm hoping the authors will fix things, but NL_CMD has the same script not found bug for years now.
Cheers!
So i downloaded your tool and set StartupConfig=ProfileForeverWriteRealtime.json in ini file. This is one of the log generated:
https://imgur.com/a/LMscSgR
Is there someway to detect what exactly makes my game freeze each time? If there are other information needed just let me know
At best it can give guidance for where to look first for opportunities to maybe optimise scripts. From just a picture, it's difficult to say much more though. The raw SVG or log file could be interesting.
https://paste.ee/p/OxIii
I had to choose another option because pastebin has a limit of 512 kb
Mostly I see the scripts I already know from prior testing that do a lot of work, but it's okay, they have to.
Eo Geom turns out to have some rather questionable scripting though.
I'd be interested in knowing where the "Placable_CreationMenu_Shortcut" script comes from, and taking a look at it. I have no idea what that script is / where it would come from. If you are using Mod Organizer 2, it could tell you where that particular file (in the Data/scripts directory) is coming from.
Though i have to say that, when i load the autosave in ReSaver from fallrimtools, it shows 2900 stacks and 200 frames also suggesting that papyrus is overloaded.
This is mostly true cause when i load the save the message "VM overstressed" appears several times, but this has always happened quite frequently in my game in the first 100 hours of gameplay and never, never during this time i had experienced more than some really rare random freeze.
So what the hell has changed now with respect to the beginning of the game? What i still cannot explain is why my game has started random freezing too frequently and, for what i can tell so far, always in the outdoors.
I hope you could help me at least in identifying a more precise direction to look at...
About the "Placable_CreationMenu_Shortcut script " i already gave a look at it and found out the file placable_creationmenu_shorcut.pex belongs to "Skyrim - Settlement Builder" mod. So i completely removed the mod and load the same autosave but nonetheless the game freezed anyway (and the new log generated by papyrus profiler didn't contain anymore this script obviously)
I deactivated the mod and did several tests always starting from the same autosave and trying to do the same actions each time. Apparently, with the mod deactivated, freezes frequency halved but i need to do a lot more tests, comparing with the cases in which this mod is activated
Anyway i am also monitoring cpu and gpu performances during gameplay and especially during freezes. Only thing noticeable is that gpu immediately drops from 100% utilization to 0% when the game freezes. I don't know if this is usual but reading on the internet it seems that gpu issues are likely to be related to freezes. Besides, when some weeks ago i started experiencing too many freezes, i underclocked my gpu using msi afterburners and the game returned playable...but some time after freezes came back, even if frequency is not the same apparently.
So my papyrus is surely overloaded but i don't know for now if it is the main culprit
Anyway how did you understood that those eo geom scripts are running constanty and are called too much? From what i can see looking the log i posted and uploaded on speedscope there are many others scripts that are called much more than these eo geom, but probably i'm not interpreting right
Eo geom I didn't recognise, so I downloaded the mod to look at the scripts, and in there I saw some questionable things. They probably actually *try* to run even much more frequently than they do in your game, but fail to because your engine is probably already clogged.
According to you is it possible though that gpu performance is negatively impacting the game and raising frezees likelihood? Otherwise i couldn't explain why underclocking gpu has made my game almost decently playable
It would be also great to know how to spot the most impacting scripts in my load order...from what i understood papyrus profiler is only able to show the frequency of scripts but not their impact in terms of engine resources
As for scripts, I also don't know of better tools to give more definitive info. I use my profiler to guide my attention/focus towards certain scripts, but I then still open up their source code and inspect them manually and just read what they do.
You were also right about Eo Geom scripts trying to run even more frequently but failing because engine is overloaded: i did some tests with the mod "Papyrus Tweaks NG" activated and modyfing some of its settings i noticed that reloading the same autosave now there is almost always a new ambush of enemies spawned by that mod. This wasn't happening before in almost all the other tests i did.
Still game freezes after a bit but i really hope to be on the right track..