


0 of 0
About this mod
Lets you monitor all currently running papyrus stacks on your game in real time!
UPDATED TO NG with new features!
New Papyrus Profiler, Pause Display, Total Calls, etc.
- Requirements
- Permissions and credits
Papyrus Stack Stalker is an SKSE plugin that offers an unparalleled, real-time window into the inner workings of Skyrim's Papyrus Virtual Machine (VM). Designed for anyone who needs to troubleshoot script-related issues—from mod authors debugging their creations to players trying to identify the cause of stutter or lag—this tool provides the information and control necessary to understand exactly what your scripts are doing at any given moment.
Core Features:
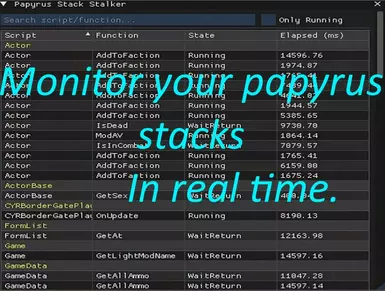
1. Live Papyrus Stack Monitor (Main Window)This is the heart of the tool. It presents a detailed, sortable table of all currently active Papyrus stacks, with the following information:
Core Features:
1. Live Papyrus Stack Monitor (Main Window)This is the heart of the tool. It presents a detailed, sortable table of all currently active Papyrus stacks, with the following information:
- Script & Function: See exactly which function within which script is currently running.
- State: Understand a stack's status (e.g.,
Running,WaitLatent,WaitCall), which helps identify if a script is actively processing or is stuck waiting for something. - Active Time: A timer showing how long a script has been in its current active state, perfect for spotting functions that are taking an unusually long time to complete.
- Interactive Table:
- Sorting: Click any column header to sort the entire list, making it easy to bring the longest-running or most recent scripts to the top.
- Filtering: Use the search bar to instantly filter the list by any part of a script or function name.
- Grouping: Scripts are automatically grouped by their prefix (e.g., all scripts from a single mod), providing a clean, organized view.
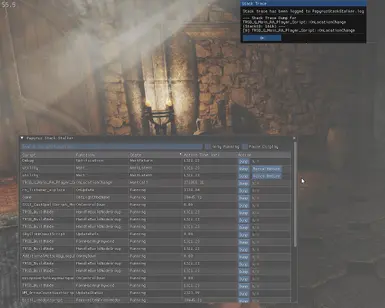
NEW- Full Stack Trace Dump: A "Dump" button allows you to capture the complete execution path of any script. When clicked, it logs the full stack trace (e.g.,FunctionCwas called byFunctionB, which was called byFunctionA) to the log file and simultaneously displays it in an in-game popup for immediate analysis. This is invaluable for debugging complex logic and unexpected behavior.- Force Return: For scripts stuck in a
WaitLatentstate (e.g., waiting for an animation or timer that may never finish), this button forces the function to return immediately, potentially un-sticking frozen game events. NEW- Pause Display: A simple checkbox freezes the UI, preventing the list from updating. This is essential for examining a script that is starting and stopping so quickly that it's hard to click on.
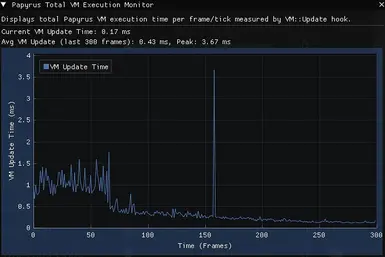
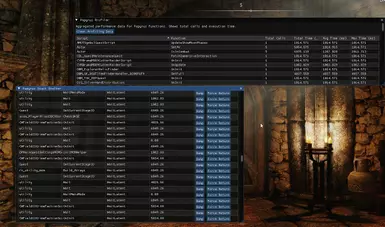
NEW- Advanced Script Profiler Accessible via the "Script Profiler" button, this opens a new window dedicated to long-term performance analysis. While the main window shows a real-time snapshot, the profiler aggregates data over your entire session to find systemic issues. It tracks:- Total Calls: The number of times a function has been executed.
- Total Time: The cumulative time spent executing a function.
- Average Time: The average execution time per call, perfect for finding consistently slow functions.
- Max Time: The single longest execution time for a function, ideal for catching intermittent spikes.This powerful tool helps you identify which functions are the true performance hogs, even if their individual runs are fast. You can clear the data at any time to begin a fresh profiling session.
- Grouping: Scripts are automatically grouped by their prefix (e.g., all scripts from a single mod), providing a clean, organized view.
- NOTE: UPDATE ROLLING OUT SOON